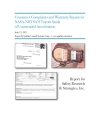
The Case of the Collapsing Seat: Weak Standards and No Oversight Led to a Fatal Defect

A renown seat safety expert has called on the U.S. Consumer Product Safety Commission and the Veterans Administration to institute random spot checks to ensure that mobility scooter and other powered wheelchair devices intended for the disabled meet minimum voluntary safety standards – and publicize any compliance failures to warn the public. Dr. Kenneth J. Saczalski, who has been at the forefront of seat strength issues for decades, made his call to action today at a meeting of the Society for the Advancement of Materials and Process Engineering meeting in Fort Worth, Texas.

Saczalski was retained by Miami attorney David Bianchi on behalf of the family of Carolyn Sorenson to determine what caused a scooter seat back to break in a products liability case against the U.S. distributors of the Daytona GT3 Electric Scooter. In January 2009, 64-year-old Sorenson died from positional asphyxiation in the trash room of her condominium building, when the plastic molded seat of her mobility scooter fractured and collapsed, causing her to fall backwards. Sorenson’s lower half remained belted in what was left of the seat, while her upper torso was wedged behind her against the door frame, according to police reports. Continue reading

Will Manufacturers Kill the Used Tires Biz?

Tiremakers have long held the re-sale market at arms length, out of a healthy respect for the boundaries of anti-trust regulations.  But a number of factors are aligning that may shift the market away from the re-sale of used tires for vehicles. The cost of selling used tires is going up – the scrap market is growing in tandem with the demand for used tires to be recycled into fuel to meet the energy requirements of rising economies, such as China’s. At the same time, tire litigation is getting more sophisticated and manufacturers have a keener understanding of their liability.

In 2007, Safety Research & Strategies kick-started this shift by publishing Used Tires: A Booming Business with Hidden Dangers. The report made the link between crashes, tire age and used tires, using data to show that nearly one-third of aged tire crashes investigated involve used tires. It also noted that inspections by used tire wholesalers are cursory and lead to dangerous tires entering the market and recommended used tire sellers adopt higher standards that included visual reviews and internal examinations, such as shearography or X-rays. Continue reading

NHTSAball: How the Agency Plays the Game

Moneyball has opened in the movie theaters, starring Brad Pitt as the redoubtable Billy Beane, general manager of the Oakland Athletics. Beane had been a future baseball superstar who washed out after three seasons of bench-warming and bouncing between Triple-A and major league teams. He was, however, that rare individual who resisted his own PR, which was certain and glowing, and the perfect foil for the movie’s real subject: baseball statistics and how numbers could guide a poor team like the A’s to the playoffs more regularly than the conventional wisdom said was possible.

The A’s, as Michael Lewis, author of the book on which it is based describes the team, was populated with Major League’s castoffs – catchers and pitchers who looked more like beer-swilling bowlers, college prospects that the talent scouts had deemed too cold to bother with, and a computer nerd for an assistant GM.  But Beane knew from his own field experience just how wrong Major League Baseball could be in assessing players. He chose, instead, to exploit a different set of metrics developed by a passionate fan who happened to be statistically apt, but shunned by the rest of Beane’s peers. Using this recipe, he cobbles together victory after victory.  The book roughly follows the A’s during the 2002 season, from the June amateur player’s draft to the historic September 4th game, in which the A’s won their 20th consecutive game – breaking a 102-year old American League record.

Among the book’s heroes is Bill James. James is the quirky inventor of Sabermetrics, the statistical analysis of baseball data, used to better understand success and failure in the game. James had a restless, numerically inclined mind and, it would be fair to say, an obsessive interest in baseball. The marriage of his aptitude and his interests produced a series of abstracts and books on baseball metrics, beginning in 1977. At first, James was ignored by all but a handful of fans. But, eventually, he gained a following. And in 1997 one of them became the manager of the Oakland A’s.

If the narrative has a villain, it’s Major League Baseball itself. Wholly in the thrall of its own myths, this billion dollar enterprise, when it bothered with data at all, used it incorrectly. Rich teams could skim the obvious cream of talent, but beyond buying wins, hadn’t a clue how it was really done.

Lewis’s point was that even with huge sums of money at stake, those most vested in the outcome can be utterly blinded by their own subjective biases. Once biases are institutionalized, they become facts, stubborn in the face of new or competing or different information. Those who can’t even identify the data that should be informing critical decisions – let alone using it properly – are bound to make expensive mistakes.

So what’s The Safety Record’s point? We saw a number of striking parallels to the way NHTSA operates, when it comes to numbers.  The agency is, ostensibly, data-driven and science-based. Hell, it slaps that phrase on everything from Powerpoint presentations to appropriations requests. But there’s plenty of evidence that the agency dismisses – out-of-hand – outside information; that long-held beliefs hamper its data analyses; that it pays way too much attention to data that is not useful and fails to collect data that is.

Moneyball: For example, here Lewis characterizes James’ assessment of MLB’s metrics:

“Worse, baseball teams didn’t have the sense to know what to collect, and so an awful lot of critical data simply went unrecorded.”

NHTSAball: There’s lots of data NHTSA doesn’t collect. For example, the agency has promulgated a recall system for tires that is predicated solely on the Tire Identification Number. Years of rulemaking were devoted to debating the format of the TIN, popularly known as the DOT code, an 11-character, alpha-numeric code that represents the plant, size, date of manufacture molded into the sidewall of a tire. The aim of the TIN was to identify a recalled tire and it is the only definitive measure to do so.  Does NHTSA require tire makers who recall their products to list the range of TINs in the recall population? No, it does not. Some manufacturers report it; others don’t. NHTSA’s good, either way. The DOT code would be a nifty little data point in any tire-related fatality in the Fatality Analysis Reporting System. The agency could use such data to identify tire failure trends, but it remains information uncollected. And while we’re on tires, NHTSA doesn’t require manufacturers to report tire claims if the tire is older than five years – so no data, no problem for the aged tire issues that took center stage following Firestone recalls in 2000 and 2001 and remain a constant source of catastrophic crashes. Continue reading

Tire Known Unknowns: Decoding the Date

Human Factors researchers at the State University of North Carolina have recently concluded that consumers can’t read the date of manufacture obscured by the week and month configuration dictated by the Tire Identification Number (aka the DOT number).

Researchers Jesseca Taylor and Michael Wogalter asked 83 test subjects to translate tire markings as represented by different date configurations, ranging from the conventional month/day/year (12/05/07) to the DOT code’s four-digit week-year (2205). Effect of Text Format on Determining Tires’ Date of Manufacture, accepted by Annual Proceedings of 55th Human Factors and Ergonomics Society, found that when consumers chose to translate the different four-digit representations into a month and year, they consistently failed to understand that the first two digits represented the week of manufacture.

The DOT number, an alpha-numeric code found on the tire sidewall, has consistently confused consumers and tire professionals. The last four characters of the 11-character code contain the week and year the tire was made. For example, 0302 signifies that the tire was made during the third week of 2002. (Tires made prior to 2000 used a three-digit date configuration at the end of the DOT code.  In those cases, 039 signifies that the tire was manufactured during the third week of 1999 – or the 1989.)  No participant in Taylor and Wogalter’s study correctly identified examples such as 03/01 or 1102. They confused the first two digits with the month itself, for example, identifying “03” as March, instead of realizing that the third week of the year falls in January. Continue reading

How Ford Concealed Evidence of Electronically-Caused UA and What it Means Today

Last month, we reported a Florida circuit judge’s extraordinary decision to set aside a civil jury verdict in favor of Ford Motor Company, based on evidence and testimony that Ford had concealed an electronic cause of unintended acceleration from the National Highway Traffic Safety Administration – and its own expert witnesses. Judge William T. Swigert’s 51-page decision in Stimpson v Ford also outlines how decades of the automaker’s dissembling to limit its liability in civil lawsuits helped to mire the thinking about root causes of unintended acceleration in the limited context of mechanical agency, even as the electronic sophistication – and the potential for defects and unanticipated interactions between systems – in vehicles grew.

That a large corporation would conceal a deadly problem to protect its interests is hardly news – although the systemic and exacting strategies Ford employed in this case are notable. What makes this story important is how Ford also re-wrote the history on this issue and helped to shape the agency’s thinking about an ongoing problem for decades hence. We have only the public record regarding Toyota UA at our disposal – and precious little of that has actually been made public – so we can’t know how Toyota has assessed its own UA problem; if and what parallels in corporate misdirection might be drawn between Ford and Toyota. But one can see how Ford’s actions back in the 1980s still resonate with the agency today and how it has kept NHTSA from advancing its knowledge in electronic causes of UA that are not already detected by the vehicle diagnostics.

The Emergence of a Defect in the Age of Audi SUA

As recounted in the Judge Swigert’s order, the history of Ford and unintended acceleration goes back to 1973, when Ford’s cruise control was under development. Ford Engineer William Follmer “warned about the risk posed by electromagnetic interference, and cautioned that ‘to avoid disaster’ it was imperative to incorporate failsafe protection against EMI in the system’s design.” In 1976, two Ford engineers obtained a patent describing a design for the cruise control system’s printed circuit board to reduce the risk of a sudden acceleration posed by EMI. Continue reading

Independent Scientists Find More Trouble in Toyotas

A new technical paper from the research scientists at the University of Maryland’s Center for Advanced Life Cycle Engineering (CALCE) buttresses the findings of the National Highway Traffic Safety Administration and NASA’s Engineering Safety Center investigation into Toyota unintended acceleration: Toyota vehicles with potentiometer type accelerator pedal position sensors have a propensity to grow tin whiskers that can and do cause shorts in a highly sensitive engine management area.

Researchers Bhanu Sood, Michael Osterman and Michael Pecht studied a pedal assemblies performed a physical analysis of an engine control system from a 2005 Camry XLE, V-6 and an accelerator pedal assembly from a defunct 2002 Camry. The 2005 engine control system included the ECM, an accelerator pedal unit, throttle body, electrical connectors and electrical connecting cables. Continue reading

NHTSA Keeps Toyota’s Secrets, Part II

Among safety advocates’ most vociferous criticisms of NHTSA and NASA’s investigation into Toyota Unintended Acceleration were the copious black smears over key bits of data and text in their twin reports released last February. These redactions have kept independent scientists from knowing exactly what the investigators did, irrespective of assessing the quality of the research.  (See: How NHTSA and NASA Gamed the Toyota Data)

Alice and Randy Whitfield of Quality Control Systems Corporation, ever the assiduous students of NHTSA’s statistical and informational folkways, went for broke. Shortly after the reports were released, they filed a Freedom of Information Act request for non-redacted versions of the reports and supporting material that was missing from the record. In response, NHTSA publicly released some of the information in the form of less redacted versions of Technical Assessment of Toyota Electronic Throttle Control (ETC) Systems and Technical Support to the National Highway Traffic Safety Administration on the Reported Toyota Motor Corporation Unintended Acceleration Investigation, but continued to withhold other information. Continue reading

How NHTSA and NASA Gamed the Toyota Data

Alice and Randy Whitfield of Quality Control Systems Corp. have released a new analysis for Safety Research & Strategies that examines the statistical underpinnings of the NHTSA and NASA reports on Toyota Unintended Acceleration which shows that the agencies based their conclusions about the possibility of an electronic cause on a series of unsupportable suppositions, miscoded data and secret warranty data reported by Toyota’s litigation defense experts, Exponent. Continue reading

Time to Examine Rear-Facing Infant Seat Safety Improvements?

That an infant seat should be placed in the rear-seat of the car, facing rearwards is an article of faith, preached by the National Highway Traffic Safety Administration and the American Academy of Pediatricians. Manufacturers only make rear-facing infant seats.

On its website, NHTSA advises:

“A rear-facing car seat is the best seat for your young child to use. It has a harness and in a crash, cradles and moves with your child to reduce the stress to the child’s fragile neck and spinal cord. Your child under age 1 should always ride in a rear-facing car seat.”

But Transport Canada researcher Suzanne Tylko presented data at the biennial Enhanced Safety of Vehicles conference that questions the certainty of that policy. Transport Canada has been at the forefront of child motor vehicle crash safety research. In particular, the agency’s dynamic testing has yielded important insights. In this three-year study, TC tested 131 child restraints in 85 motor vehicle crash tests. The vast majority were rigid barrier tests on rear-facing infant seats, secured by a three-point belt conducted at speed of 48km/h; 11 were conducted at 56 km/h; and seven were conducted at 40 km/h. TC also tested seats in offset deformable barrier tests, conducted at 40 km/h. (Fourteen tests involved convertible seats installed facing the rear.) Continue reading

Memo to the Medical Device Industry: You’ve Got Problems

FDA News, a purveyor of U. S. Food and Drug Administration regulatory and international standards compliance newsletters, books, special reports and conferences, gathered the medical devices industry to a come-to-Jesus meeting last week and the warnings were stern: quality has been low and the number of U.S. Food and Drug Administration warnings and recalls is high. Medical device manufacturers haven’t met the bar for quality control and the regulations are about to get a whole lot tighter.

Presenters at the three-day conference on risk management and post-market surveillance reeled off a list of unhappy statistics:

Adverse events are growing faster than the market. Infusion pumps, automated external defibrillators and catheters produced 65 percent of the serious adverse events from 2005-2009, according to FDA data.

In 2010, the FDA issued 89 warning letters for Quality Systems deficiencies.

Nearly one-third of all medical device recalls occur as a result of design and/or manufacturing defects and root cause analyses shows that there are wide gaps in product design, manufacturing process control, and supplier management. (The FDA can also require a recall based on a wide variety of non-conformance issues including bad record-keeping, failing to report death and injuries associated with a device and failure to establish a corrective action plan.) Continue reading